


|
|
|
We are working on a Matlab and shell script toolbox for the analysis of MRI data. The goal of this toolbox is not to replace the excellent software packages that are freely available such as FSL and SPM, but to provide a complementary set of tools aimed at comparing the organisation of different brains.
The toolbox is currently still under production, but a limited set of functions is available to collaborators. Please contact us if you are interested. A (very) small number of functions are released on GitHub as a pilot project.
The toolbox is tentatively called the MR Comparative Anatomy Toolbox (Mr Cat).
Below we describe some of the types of analysis that can be performed with the toolbox
 Connectivity-based parcellations
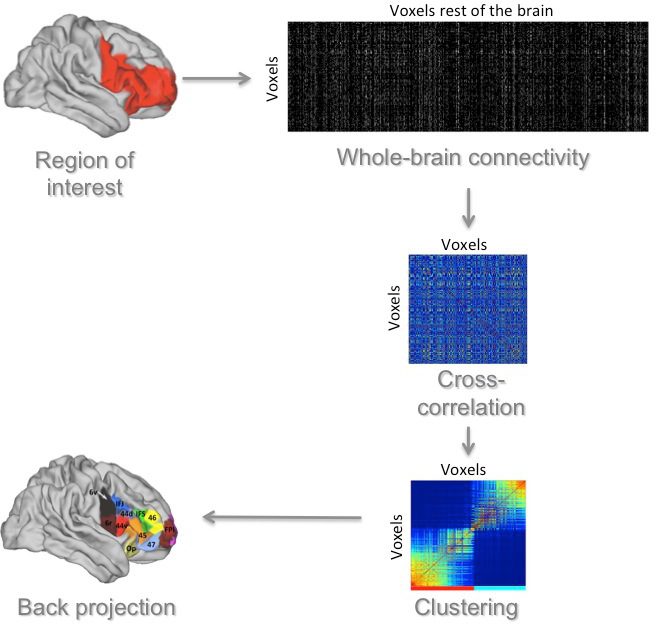
Connectivity-based parcellations aim to group together voxels in the brain based on their similarity of connections with other parts of the brain.
We have mostly applied this type of analysis to diffusion MRI tractography data, but it can also be applied to other types of data, such as resting state functional connectivity. In most of our studies we (1) determine the connectivity of all voxels in a region of interest to all voxels in the rest of the brain, (2) calculate a cross-correlation matrix that shows for each voxel in the region of interest how similar its connectivity is to that of each other voxel in the region of interest, (3) use a clustering algorithm such as kmeans to group together voxels with a similar connectivity profile, and (4) back project these voxels to the brain.
We have used this method to study parietal (Mars et al., 2011, J Neurosci), temporoparietal (Mars et al., 2012, Cereb Cortex), and frontal (Sallet et al., 2013, J Neurosci; Neubert et al., 2014, Neuron; Neubert et al., 2015, Proc Natl Acad Sci USA) cortex. The results of these studies are available in our connectivity-based parcellation atlases.
 Connectivity fingerprint matching
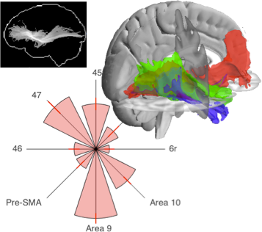
One way to compare the organisation of different brains is to compare the connectivity fingerprints of areas across species. In our recent studies on the frontal cortex (Sallet et al., 2013, J Neurosci; Neubert et al., 2014, Neuron) we compared the connectivity fingerprints of areas we found in our connectivity-based parcellations of the human cortex with those from areas in the macaque brain. We calculated the Manhattan distance between each human area and all macaque areas to determine which areas are most similar between species. Using this method, we could show similarities between brain areas in the human and macaque, but also identified a uniquely human area in the lateral frontal pole.
Taking this approach a step further we used the connectivity fingerprint of the human temporoparietal junction area (TPJ) to search for a potential homologue in the macaque brain, which was found in the middle part of the superior temporal sulcus (Mars et al., 2013, PNAS).
This approach is reviewed in Mars et al. (2016, Neurosci Biobehav Rev).
 Visualization
Data visualization is of crucial importance to understanding and communicating data. We have developed various tools to visually represent neuroimaging data. To date, the tools are mostly focused on representing the white matter architecture of the brain, including maximum intensity projections (the "glass brain"), 3D tract courses, and connectivity fingerprints.
Most of these tools were first used in the our extreme capsule paper (Mars et al., in press, Brain Struct Funct).
In addition, we are working on a number of tools to visualise graphs representing connectivity data.
Gradient analysis
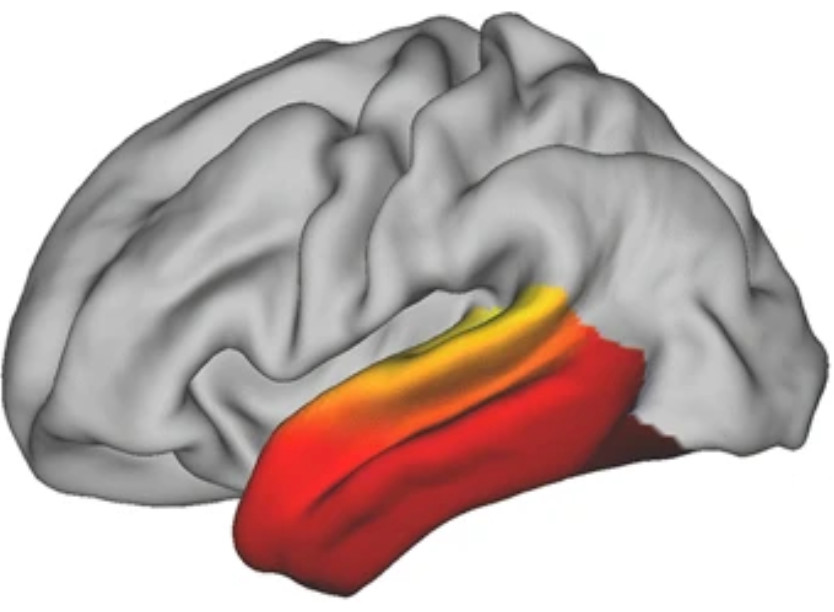 Gradient are method of describing brain organization that has recently gained in popularity. We have worked on connectivity gradients (conngrads) and functional gradients (funcgrads).
Guilherme Blazquez Freches, in collaboration with Christian Beckmann's lab, has implemented conngrads in Mr Cat and used it to study the organization of the human temporal lobe (see figure). He demonstrated three overlapping gradients. In follow-up work, we are now studying how these gradients differ from those seen in non-human primates.